

Course Description
This course will teach you everything you need to know to create amazing and professional looking charts and diagrams using Microsoft's comprehensive software solution: Visio 2021 (the latest version).
Visio 2021 and Diagramming
There are several diagramming programs on the market. Some are free of cost, and others are not. Visio 2021 is not free, but it can be purchased outright for $580 or using monthly subscription payments. The $580 price is for the Professional version that most organizations use for the additional enterprise features. You can also pay $15 each month for a Professional version subscription. If you only need basic Visio 2021 features, you can purchase the basic subscription for $5 each month.
Computer diagramming is the process of using basic shapes and text to display a project workflow or logic design. Basic shapes are used because they are easy to resize and edit while still maintaining their original shape. Graphics lose their quality when you resize them, but you can resize a basic shape such as a square or circle and still maintain its line structure. This is possible because diagram software such as Visio uses vector shapes. Vector shapes are mathematical representations of shapes that can be made bigger or smaller without losing any of the quality from the original graphic. The SVG image file format is the most common vector image used in diagramming programs including Visio 2021. If you decide to use any other diagramming program, it should use the SVG vector format for portability and scalability of the images.
The type of diagram that you want to make will determine the shapes that you use. Visio 2021 can create basic diagrams or very complex ones that have several advanced shapes that represent a part of your process. Basic diagrams are the most common, and they use simple shapes such as squares, rectangles, circles and straight lines to connect them.
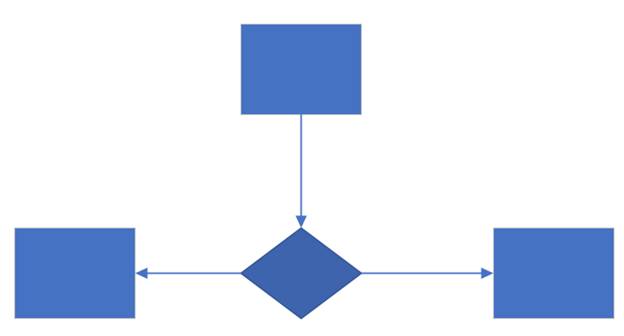
The lines that connect each shape are shown as arrows. The arrows describe the workflow for the diagram. Usually, a shape representing the start of the workflow starts at the top and at least one arrow points to an additional shape. Each shape also represents a type of decision or instructions in your diagram. For instance, a diamond-shaped rectangle represents a logical decision such as "Yes" and "No." Each answer from the question has an arrow pointing from the corner to the next step in the diagram based on the answer.
A good example of a decision branch in a basic diagram is common in software development. A user is shown a window where they can make a change to software settings and click "OK" or click the "Cancel" button and back out of the changes. A diamond-shaped rectangle represents the window shown to the user. If the user makes a change to settings and clicks "OK," then an arrow pointing right to a rectangle shape that displays what the software will do (e.g. save changes to the local Windows registry) explains the next step in the software's workflow. If the user clicks "Cancel," an arrow pointing left to a rectangle that displays what happens after the button is clicked (e.g. return the user to the main window and make no changes to the registry).
Diagrams can be very simple with only a few shapes comprising the workflow or extremely complex with hundreds of shapes that span multiple pages. Regardless of the number of shapes, the rules to diagramming remain the same, and any user who reads your workflow should be able to understand it based on shapes and basic text describing each step.
This course starts by explaining the basic features of Visio including menu items, interface components and the Quick Access bar. It then goes into more intermediate features such as templates, stencils and adding a shape to your diagram. These shapes are connected using Visio Connectors, which are also explained.
Visio diagrams are more than just shapes. They can also comprise images, graphics, and data. You can also insert other files and their images into a Visio diagram. Data being the most important in projects, this course covers how to create data sets and link them to your shapes. This data can be exported when printing diagrams to a hardcopy or sending the Visio file to a third-party reader.
Finally, the course covers creating your own custom shapes and saving them for future use as master shape templates. You can then learn how to print and share these diagrams with other readers. Sharing can be via using a printer to create a hardcopy or share the file using the OneDrive account Microsoft creates when you sign up for an Office 365 account. With this course, you can create an IT, rack, basic flowchart, and many other diagrams for your business.
- Completely Online
- Self-Paced
- Printable Lessons
- Full HD Video

- 6 Months to Complete
- 24/7 Availability
- Start Anytime
- PC & Mac Compatible
- Android & iOS Friendly
- Accredited CEUs

Assessment Guide
| Assessment | Points |
|---|---|
| Why do you want to learn Visio? | 2 points |
| Lesson 1 Quiz | 18 points |
| Lesson 2 Quiz | 20 points |
| Lesson 3 Quiz | 20 points |
| Lesson 4 Quiz | 20 points |
| Lesson 5 Quiz | 20 points |
| Lesson 6 Quiz | 20 points |
| Lesson 7 Quiz | 20 points |
| Lesson 8 Quiz | 20 points |
| Lesson 9 Quiz | 20 points |
| Lesson 10 Quiz | 20 points |
| Lesson 11 Quiz | 20 points |
| Lesson 12 Quiz | 20 points |
| Lesson 13 Quiz | 20 points |
| The Final Exam | 118 points |


Loading...


Follow Us Online